

MapLibre vs Leaflet vs OpenLayers
The three open-source libraries for maps in a web page, compared on how they draw, vector tiles, 3D, projections, data formats and download size, with the same map drawn by each. The figures are from 2 November 2026.
- MapLibre GL JS when the base map matters: vector styles, smooth zoom, tilt, 3D terrain and a globe. It needs WebGL 2 and is the largest download.
- Leaflet for markers, popups and shapes on a base map, with many plugins, in the smallest download. Vector tiles need a plugin.
- OpenLayers for GIS work: many formats and map services, any projection, drawing and editing built in.
Side by side
| MapLibre GL JS | Leaflet | OpenLayers | |
|---|---|---|---|
| Latest version | 6.16.0, 25 Oct 2026 | 1.9.4, 18 May 2023; 2.0.0-beta.1 on 2 Nov 2026 | 10.11.0, 4 Oct 2026 |
| npm downloads, 26 Oct to 1 Nov 2026 | 9.1 million | 10.9 million | 1.2 million |
| Licence | BSD-3-Clause | BSD-2-Clause | BSD-2-Clause |
| Draws with | WebGL 2 | Image tiles, with SVG or canvas for shapes | Canvas 2D, WebGL for some layers |
| Vector tiles with a style | Built in | Through a plugin | Built in; MapLibre styles through ol-mapbox-style |
| Tilt and 3D terrain | Yes | No | No |
| Rotation | Yes | No | Yes |
| Projections | Web Mercator and a globe | Web Mercator; others with Proj4Leaflet | Any projection that proj4 defines; image layers are reprojected |
| Data formats | GeoJSON, vector and raster tiles, images, video | GeoJSON and WMS; others through plugins | GeoJSON, KML, GPX, GML, TopoJSON, WKT, WFS, WMS, WMTS, GeoTIFF and more |
| Drawing and editing | Through plugins | Through plugins | Built in |
| TypeScript types | Included | In @types/leaflet | Included |
Versions, dates, licences and downloads from the npm registry. The npm downloads count every install, also through other packages such as react-map-gl.
The same map in each
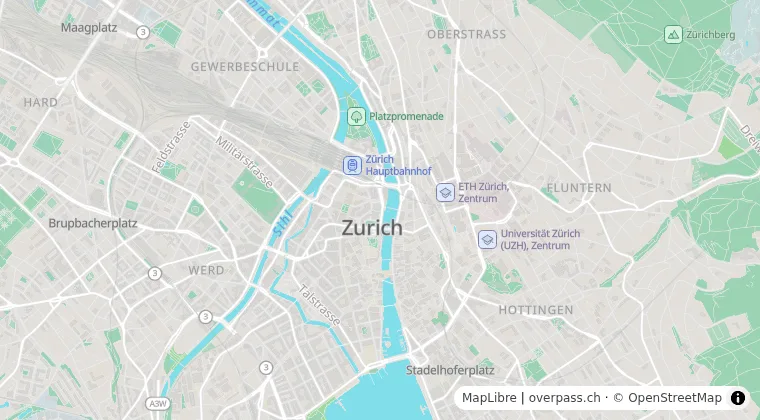
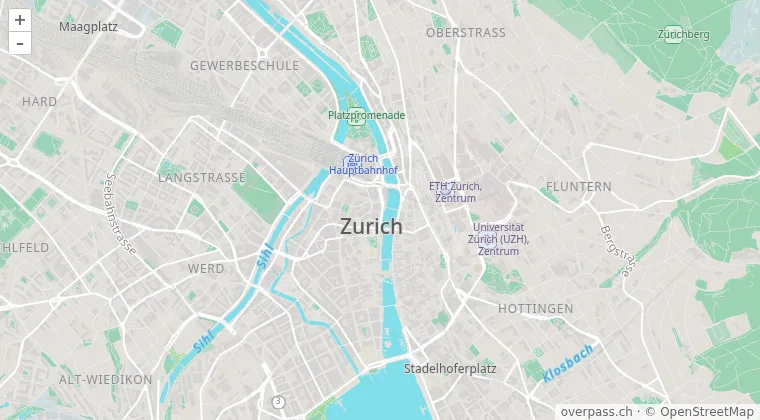
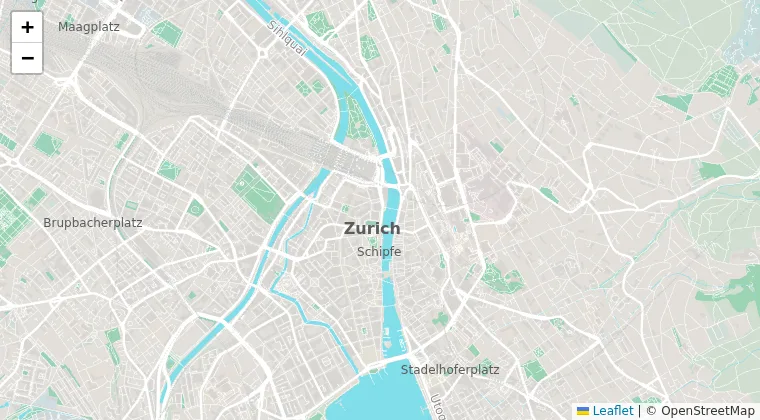
Our light style over Zurich, drawn by each library from the same vector tiles:
Download size
| A minimal map | JavaScript, gzip |
|---|---|
| Leaflet with image tiles | 41 KB |
| OpenLayers with image tiles, bundled | 66 KB |
| Leaflet with protomaps-leaflet | 77 KB |
| OpenLayers with ol-mapbox-style, bundled with Vite | 151 KB |
| Leaflet with maplibre-gl-leaflet and MapLibre 5 | 311 KB |
| MapLibre GL JS 6.16, bundled with Vite | 282 KB, and 143 KB for the worker |
Measured on the minified files from npm, or on a build of a page with one map, compressed with gzip -9. Image tiles are pictures from a tile server; overpass.ch serves vector tiles only.
MapLibre GL JS
MapLibre began in December 2020 as a fork of Mapbox GL JS 1.13, and draws the whole map on the graphics card: zoom and rotation are smooth, and the map tilts to show 3D terrain and buildings. A style describes all of it in one JSON file, so changing the colours or the language of the labels needs no new tiles. MapLibre 6 needs WebGL 2 and comes as ES modules only. Our styles are made for it.
MapLibre GL JS tutorial: your first map
Leaflet
Leaflet puts image tiles in a grid and markers, popups and shapes on top, with SVG or canvas. Its plugins cover clustering, heat maps, drawing, routing and much else. It has no renderer for vector tiles: maplibre-gl-leaflet puts a MapLibre map into Leaflet as a layer, and protomaps-leaflet draws the Protomaps tiles on canvas. Leaflet 2.0 is in beta: it comes as ES modules, and new Marker(…) replaces L.marker(…).
OpenLayers
OpenLayers reads most GIS formats and services itself, works in any projection that proj4 defines, and has tools to draw, modify and snap features. It draws vector tiles on canvas, and ol-mapbox-style turns a MapLibre style into OpenLayers styles; some parts of the style specification are missing, so not every style looks as in MapLibre. For those, MapLibre can draw the base map as an OpenLayers layer.
Vector map tiles in OpenLayers
Moving from Leaflet to MapLibre
- Coordinates turn around: Leaflet takes
[latitude, longitude], MapLibre and GeoJSON[longitude, latitude]. - Zoom levels differ by one: MapLibre zoom 12 shows the area of Leaflet zoom 13.
L.markerbecomesmaplibregl.Marker,bindPopupbecomessetPopup, and GeoJSON layers become a source and a layer of the style.
The tiles
All three show the vector tiles and styles of overpass.ch with one style URL and one key. Every account includes 100'000 map tiles a month; the map tiles page has the styles on a live map and the prices.